What you’ll learn
- 1Describe how Arduino and Processing communicate over a serial (USB) connection at the same baud rate.
- 2Write active Processing sketches using
setup()anddraw(), shapes, colours and text. - 3Use the coordinate system (origin top-left, Y grows downward) to place elements precisely.
- 4Scale sensor values to screen sizes with
map()and format numbers withnf(). - 5Receive, validate and parse single values and comma-separated values (CSV) in
serialEvent(). - 6Send commands from Processing back to Arduino with mouse clicks and key presses.
- Processing
- A free, Java-based language and environment for visual and interactive programs, created at the MIT Media Lab in 2001.
- PDE
- Processing Development Environment — the editor, console and toolbar where you write sketches.
- Serial communication
- Sending data one bit after another over a wire — here, the USB cable between Arduino and computer.
- Baud rate
- Speed of serial communication in bits per second (e.g. 9600). Both sides must match.
- COM port
- The name your computer gives the Arduino’s serial connection (e.g. COM3 or /dev/ttyUSB0).
- CSV
- Comma-Separated Values, e.g.
23.5,61.0— several numbers in one line of text. - Parsing
- Turning text (a String) into usable data (numbers).
- Frame
- One execution of
draw(). Processing draws ~60 frames per second.
Required equipment
| Component | Qty | Purpose |
|---|---|---|
| Processing IDE 4.x | 1 | Writing and running visualizations — processing.org |
| Arduino IDE 2.x | 1 | Programming the Arduino board — arduino.cc |
| Arduino Uno | 1 | Sending sensor data over serial |
| USB cable | 1 | Connecting Arduino to the computer |
| Any sensor | 1 | DHT11, LDR, HC-SR04 … to generate data |
What is Processing?
Processing is a free, open-source programming environment designed for visual output, animation and interaction. In Arduino projects it is the visual dashboard: it cannot control hardware directly, but it is excellent at receiving data and turning numbers into compelling visuals.
| Feature | Arduino IDE | Processing |
|---|---|---|
| Primary purpose | Control hardware (sensors, motors) | Create visual output (graphics, charts) |
| Runs on | Microcontroller (Arduino board) | Computer (Windows, macOS, Linux) |
| Output | Signals to components | Graphics on screen |
| Data flow | Sends data via Serial | Receives data via Serial |
| Language base | C / C++ | Java (also Python & JavaScript modes) |
| Sketch structure | setup() + loop() | setup() + draw() |
How Arduino and Processing Work Together
The two programs talk through serial communication over the USB cable. Every project in the series follows the same pipeline:
- 01A sensor reads a physical value (temperature, distance, light …).
- 02Arduino processes the value and sends it with
Serial.println(). - 03Processing receives the text, parses it and converts it to a number.
- 04Processing draws text, bars, colours or shapes on the screen.
Serial.begin(9600) — Processing: new Serial(this, port, 9600).Sketch Structure & Events
Every Processing program (a sketch) has two main functions — just like Arduino — plus optional event functions that run when something happens.
| Function | When it runs | Typical use |
|---|---|---|
setup() | Once, at program start | size(), serial setup, initial variables |
draw() | Continuously (~60 fps) | background(), text(), rect(), shapes |
serialEvent() | When new serial data arrives | Read and parse incoming Arduino data |
mousePressed() | When a mouse button is clicked | UI buttons, interactions |
keyPressed() | When a key is pressed | Send commands back to Arduino |
void setup() {
  // Runs ONCE at the start
  // Set window size, initialize serial port
}

void draw() {
  // Runs CONTINUOUSLY — like loop() in Arduino
  // Draw shapes, text, update the display
}
The Serial library
import processing.serial.*;   // 1. Import the library

Serial myPort;                // 2. Declare the serial port object

void setup() {
  size(400, 300);
  printArray(Serial.list());  // 3. List available ports
  // 4. Open the port — index [0] is usually the first available
  myPort = new Serial(this, Serial.list()[0], 9600);
  myPort.bufferUntil('\n');   // 5. Call serialEvent() once per full line
}Serial.list()[0] is the wrong port, look at the list printed by printArray(Serial.list()) in the console and change the index.Drawing, Colour & Coordinates
| Function | Description | Example |
|---|---|---|
size(w, h) | Set window width and height | size(600, 400) |
background(r,g,b) | Fill background with a colour | background(255) — white |
fill(r,g,b) | Set fill colour for shapes | fill(255, 0, 0) — red |
stroke(r,g,b) | Set outline colour | stroke(0) — black |
text(str, x, y) | Draw text at a position | text("Hello", 50, 100) |
textSize(n) | Set font size | textSize(20) |
rect(x, y, w, h) | Draw a rectangle | rect(50, 100, 200, 30) |
ellipse(x, y, w, h) | Draw an ellipse / circle | ellipse(200, 200, 50, 50) |
line(x1,y1,x2,y2) | Draw a line | line(0, 0, 200, 200) |
map(v,lo1,hi1,lo2,hi2) | Scale a value to a new range | map(temp, 0, 100, 0, 300) |
nf(n, d1, d2) | Format a number as text | nf(3.14159, 1, 2) → "3.14" |
Colour in Processing
Processing uses RGB values from 0 to 255. A fourth value (alpha) sets transparency.
One number means greyscale: fill(0) is black, fill(255) is white.
fill(255, 0, 0);      // Red
fill(0, 255, 0);      // Green
fill(0, 0, 255);      // Blue
fill(255, 255, 0);    // Yellow
fill(128, 0, 128);    // Purple
fill(0);              // Black (shorthand)
fill(255);            // White (shorthand)
fill(255, 0, 0, 150); // Semi-transparent red
The coordinate system
The origin (0, 0) is in the upper-left corner. X grows to the right; Y grows downward. In a 320 × 240 window, (319, 239) is the last visible pixel in the lower-right corner.
rect(50, 100, 200, 30) starts 100 pixels from the top — not the bottom. To draw a bar that grows upward, start at height - barHeight.map() — the Most Important Function
map() rescales a value from one range to another. Sensor values (0–1023) almost never fit your screen directly, so you will use map() in every project.
// Sensor value 0–1023 mapped to bar width 0–300 pixels:
float barWidth = map(sensorValue, 0, 1023, 0, 300);
rect(50, 100, barWidth, 30);

// Temperature 0–50 °C mapped to the red colour component:
float r = map(temperature, 0, 50, 0, 255);
fill(r, 0, 0);map() does not clamp. If the value goes outside the input range, the result goes outside the output range. Wrap it in constrain(x, min, max) when you need limits.The Processing Development Environment
The PDE contains a text editor, a compiler and a display window. It has a message area, a text console, tabs for files, a toolbar and menus. Full reference: processing.org/environment.
| Component | Purpose |
|---|---|
| Text editor | Write and edit sketch code |
| Message area | Feedback while saving, exporting and errors |
| Console | Text output from print() and println() |
| Toolbar | ▶ Run (compile + open window) and ■ Stop |
| Tabs | Manage multiple files within one sketch |
| Menus | File, Edit, Sketch, Debug, Tools, Help |
Most-used menu commands
| Menu | Command | What it does |
|---|---|---|
| File | New / Open / Save As… | Create, open, or save a copy of a sketch |
| File | Examples… | Browse built-in example sketches — great for learning |
| File | Export Application… | Create a standalone program from your sketch |
| Edit | Auto Format | Tidy indentation (Ctrl+T) |
| Edit | Comment / Uncomment | Toggle // on the selected lines |
| Sketch | Present | Run full-screen (Esc to exit) |
| Sketch | Tweak | Change numbers and colours live while running |
| Sketch | Import Library… | Add import lines or install new libraries |
| Sketch | Add File… | Copy images/fonts into the sketch’s data/ folder |
| Debug | Enable Debugger | Breakpoints, Step, Step Into, Step Out |
| Tools | Color Selector… | Pick colours and copy RGB/HSB/Hex values |
| Tools | Archive Sketch | Save a .zip copy of the sketch |
Sketches and the Sketchbook
Each sketch lives in its own folder; the main file has the same name as the folder with a .pde extension. Images, fonts and sounds go into a data/ sub-folder. Find the Sketchbook location in File → Preferences.
MyProject/              ← sketch folder
├── MyProject.pde       ← main file (same name as folder)
└── data/               ← images, fonts, sounds
Renderers
| Renderer | Description | Best for |
|---|---|---|
| Default | Standard 2D renderer | Most 2D sketches and sensor displays |
P2D | Faster OpenGL 2D | High-speed 2D graphics |
P3D | 3D with camera, lighting, materials | 3D visualizations |
FX2D | High-quality JavaFX 2D | Large / high-resolution displays |
Choose a renderer as the third argument of size(), e.g. size(400, 300, P3D);.
Static vs. active sketches
Static — no setup()/draw(); runs once. Good for learning coordinates, shapes and colour.
size(200, 200);
background(255);
noStroke();
fill(255, 204, 0);
rect(30, 20, 50, 50);
Active — uses setup() + draw() for animation, sensors and interaction.
void setup() {
  size(200, 200);
  noStroke();
  fill(0, 102, 153, 204);
}
void draw() {
  background(255);
  rect(width - mouseX, height - mouseY, 50, 50);
  rect(mouseX, mouseY, 50, 50);
}import processing.serial.*;.Lab 1 — Your First Processing Sketch
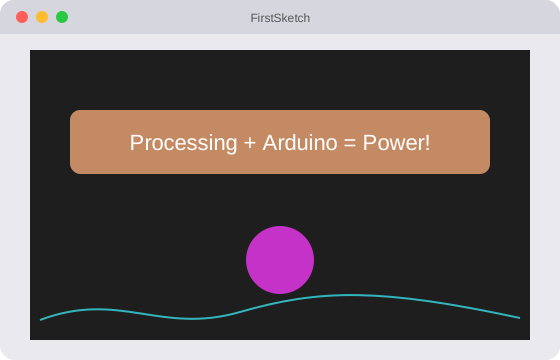
Before connecting Arduino, get comfortable with the environment: draw a rounded rectangle, some text, and a circle whose colour changes over time.
float t = 0;

void setup() {
  size(500, 300);
  textAlign(CENTER, CENTER);
}

void draw() {
  background(30);                 // dark grey background
  t++;

  // Animated colour using sine waves
  float r = 127 + 127 * sin(t * 0.05);
  float g = 127 + 127 * sin(t * 0.03);

  // Rounded rectangle (last argument = corner radius)
  fill(r, g, 100);
  rect(50, 80, 400, 60, 10);

  // White text centred in the rectangle
  fill(255);
  textSize(22);
  text("Processing + Arduino = Power!", 250, 110);

  // Animated circle
  fill(r, 50, 200);
  ellipse(250, 220, 60, 60);
}t instead of redeclaring Processing’s built-in frameCount.| Concept | Where in the code |
|---|---|
| Window size | size(500, 300) in setup() |
| Continuous animation | draw() runs ~60 times per second |
| Dynamic colour using maths | sin() of a growing number |
| Rectangle | rect(x, y, width, height, radius) |
| Text | text(), textSize(), textAlign() |
| Circle | ellipse(cx, cy, width, height) |
Lab 2 — Receiving Data from Arduino
Arduino sends a counter (0–100) every 500 ms; Processing shows it as text and as a bar.
int counter = 0;

void setup() {
  Serial.begin(9600);
}

void loop() {
  Serial.println(counter);   // send number to Processing
  counter++;
  if (counter > 100) counter = 0;
  delay(500);
}import processing.serial.*;
Serial myPort;
int receivedValue = 0;
void setup() {
size(400, 250);
printArray(Serial.list()); // check available ports
myPort = new Serial(this, Serial.list()[0], 9600);
myPort.bufferUntil('\n');
}
void draw() {
background(240);
fill(50);
textSize(20);
text("Received from Arduino: " + receivedValue, 50, 80);
fill(100, 150, 255);
float barW = map(receivedValue, 0, 100, 0, 300);
rect(50, 120, barW, 40);
fill(0);
textSize(16);
text(receivedValue + " / 100", 50 + barW/2, 145);
}
void serialEvent(Serial p) {
String incoming = p.readStringUntil('\n');
if (incoming != null) {
incoming = trim(incoming);
if (incoming.matches("\\d+")) { // only digits? then it is safe
receivedValue = int(incoming);
}
}
}| Part | Explanation |
|---|---|
import processing.serial.* | Imports the serial communication library |
Serial myPort | Object that represents the serial port connection |
Serial.list()[0] | Selects the first available COM port |
serialEvent(Serial p) | Called automatically when new data arrives |
readStringUntil('\n') | Reads one line of text up to the newline |
trim() | Removes spaces and newline characters |
matches("\\d+") | True only if the text contains digits only (safe parsing) |
map(value, 0, 100, 0, 300) | Scales 0–100 to a pixel width of 0–300 |
Lab 3 — Parsing Multiple Values (CSV)
In Projects 1, 3 and 5 Arduino sends several values in one line, separated by commas. This is the pattern you’ll reuse again and again.
void setup() {
  Serial.begin(9600);
}

void loop() {
  float temperature = 23.5;   // in the real project: a sensor reading
  float humidity    = 61.0;

  Serial.print(temperature);
  Serial.print(",");          // comma separator
  Serial.println(humidity);   // newline at the end
  delay(1000);
}import processing.serial.*;
Serial myPort;
float temperature = 0;
float humidity = 0;
void setup() {
size(500, 300);
myPort = new Serial(this, Serial.list()[0], 9600);
myPort.bufferUntil('\n');
}
void draw() {
background(255);
fill(0);
textSize(22);
text("Temperature: " + nf(temperature, 1, 1) + " \u00B0C", 50, 100);
text("Humidity: " + nf(humidity, 1, 1) + " %", 50, 150);
fill(220, 50, 50); // temperature bar
rect(50, 170, map(temperature, 0, 50, 0, 380), 25);
fill(50, 100, 220); // humidity bar
rect(50, 210, map(humidity, 0, 100, 0, 380), 25);
}
void serialEvent(Serial p) {
String data = p.readStringUntil('\n');
if (data != null && data.contains(",")) {
String[] values = split(trim(data), ",");
if (values.length == 2) {
temperature = float(values[0]);
humidity = float(values[1]);
}
}
}| Step | Code | Why |
|---|---|---|
| 1. Read line | readStringUntil('\n') | Wait for a complete line |
| 2. Check not null | if (data != null) | Avoid errors on empty reads |
| 3. Check format | data.contains(",") | Confirm it is CSV |
| 4. Split | split(trim(data), ",") | Divide into an array at each comma |
| 5. Check length | values.length == 2 | Ensure the right number of values |
| 6. Convert | float(values[0]) | Turn text into a number |
- 1readStringUntil('\n')"23.5,61.0"
- 2data != null
- 3data.contains(",")
- 4split(trim(data), ",")["23.5", "61.0"]
- 5values.length == 2length = 2
- 6float(values[0]), float(values[1])23.5, 61
Line accepted and displayed.
Lab 4 — Sending Commands Back to Arduino
Communication works both ways. Processing can send a character to switch a pump (Project 5) or start a servo (Project 3). Here, mouse clicks and keys switch the built-in LED.
void setup() {
  Serial.begin(9600);
  pinMode(13, OUTPUT);              // built-in LED
}

void loop() {
  if (Serial.available() > 0) {
    char cmd = Serial.read();
    if (cmd == '1')      digitalWrite(13, HIGH);  // LED ON
    else if (cmd == '0') digitalWrite(13, LOW);   // LED OFF
  }
}import processing.serial.*;
Serial myPort;
boolean ledOn = false;
void setup() {
size(400, 220);
myPort = new Serial(this, Serial.list()[0], 9600);
textAlign(CENTER, CENTER);
}
void draw() {
background(240);
fill(30);
textSize(18);
text("Arduino LED Control", 200, 30);
text("Click buttons or press 1 / 0 on keyboard", 200, 60);
fill(ledOn ? color(0, 200, 0) : color(180)); // ON button
rect(60, 100, 120, 50, 8);
fill(255);
text("ON", 120, 125);
fill(!ledOn ? color(200, 50, 50) : color(180)); // OFF button
rect(220, 100, 120, 50, 8);
fill(255);
text("OFF", 280, 125);
fill(30);
textSize(16);
text("Status: LED is " + (ledOn ? "ON" : "OFF"), 200, 190);
}
void setLed(boolean on) {
myPort.write(on ? '1' : '0');
ledOn = on;
}
void mousePressed() {
if (mouseX > 60 && mouseX < 180 && mouseY > 100 && mouseY < 150) setLed(true);
if (mouseX > 220 && mouseX < 340 && mouseY > 100 && mouseY < 150) setLed(false);
}
void keyPressed() {
if (key == '1') setLed(true);
if (key == '0') setLed(false);
}| Project | Sensor | Visualization | Key technique |
|---|---|---|---|
| 1 — DHT11 | Temperature & humidity | Two-value text + bars | CSV parsing, 2 values |
| 2 — LDR | Light intensity | Single bar + colour change | map(), background colour |
| 3 — HC-SR04 | Distance (sonar) | Radar sweep display | Trigonometry, ellipse, line |
| 4 — Ohm meter | Resistance | Numeric display + gauge | nf(), arc(), text |
| 5 — Irrigation | Soil moisture | Status display + bar | Threshold logic, fill colour |
Arduino vs. Processing — Quick Reference
| Concept | Arduino IDE | Processing |
|---|---|---|
| Program entry point | setup() + loop() | setup() + draw() |
| Print to console | Serial.println() | println() |
| Read input | Serial.read() | myPort.readStringUntil() |
| Delay / pause | delay(ms) | delay(ms) — avoid in draw() |
| Variable types | int, float, char, bool | int, float, String, boolean |
| Draw rectangle / text | — (no screen) | rect(), text() |
| Colour | — (no screen) | fill(), stroke() |
| Event handling | — | mousePressed(), keyPressed() |
| Import library | #include <Lib.h> | import library.*; |
Student tasks
Troubleshooting
| Problem | Likely cause | Fix |
|---|---|---|
| Port not found / empty Serial.list() | Arduino not connected or driver missing | Check USB; install the CH340 driver for clone boards. |
| Port busy / in use | Arduino Serial Monitor still open | Close the Serial Monitor in the Arduino IDE first. |
| No data received | Wrong index in Serial.list()[0] | Run printArray(Serial.list()) and choose the right index. |
| Garbage characters | Baud rate mismatch | Use 9600 on both sides. |
| NullPointerException | data is null (incomplete line) | Always check if (data != null). |
| Wrong / garbage values on screen | Parsing non-numeric text | Validate with data.matches("\\d+") or check length after split(). |
| Sketch freezes | Heavy work or delay() inside draw() | Read serial in serialEvent(); never block draw(). |
Exercises
map() by hand
Calculate each result without a computer, then check with the playground above.
a) map(512, 0, 1023, 0, 300)
b) map(25, 0, 50, 0, 255)
c) map(750, 1023, 300, 0, 100)
Where will it appear?
In a size(400, 300) window, describe where each shape appears: ellipse(200, 150, 40, 40), rect(0, 280, 400, 20), ellipse(width, 0, 60, 60).
Bouncing ball
No hardware: make a ball move across the window and bounce off all four walls. Change its colour every time it hits a wall.
float x = 100, y = 100, dx = 3, dy = 2;
color c = color(61, 245, 255);

void setup() {
  size(500, 300);
  noStroke();
}

void draw() {
  background(20);
  x += dx;
  y += dy;
  if (x < 15 || x > width - 15)  { dx = -dx; c = color(random(255), random(255), random(255)); }
  if (y < 15 || y > height - 15) { dy = -dy; c = color(random(255), random(255), random(255)); }
  fill(c);
  ellipse(x, y, 30, 30);
}Why is the screen blank?
Arduino is sending numbers, but this sketch shows nothing and sometimes crashes with a NullPointerException. Find the problems.
import processing.serial.*;
Serial myPort;
int value;

void setup() {
  size(400, 200);
  myPort = new Serial(this, Serial.list()[0], 115200);
}

void draw() {
  fill(0);
  text(value, 50, 100);
}

void serialEvent(Serial p) {
  value = int(trim(p.readStringUntil('\n')));
}background() in draw(), so numbers pile on top of each other (and default fill is drawn on grey — text may be unreadable). 3) readStringUntil() can return null — check before trim(). Adding myPort.bufferUntil('\n') in setup() also helps.Real-time line graph
Extend Lab 2: keep the last 100 received values in an array and draw them as a scrolling line graph across the window.
vals[i] = vals[i+1]) and put the new value at the end. Use map() for both X (index → width) and Y (value → height, reversed!).import processing.serial.*;
Serial myPort;
int[] vals = new int[100];
void setup() {
size(600, 300);
myPort = new Serial(this, Serial.list()[0], 9600);
myPort.bufferUntil('\n');
}
void draw() {
background(15);
stroke(61, 245, 255);
strokeWeight(2);
noFill();
beginShape();
for (int i = 0; i < vals.length; i++) {
float x = map(i, 0, vals.length - 1, 20, width - 20);
float y = map(vals[i], 0, 100, height - 20, 20); // reversed: bigger = higher
vertex(x, y);
}
endShape();
}
void serialEvent(Serial p) {
String s = p.readStringUntil('\n');
if (s == null) return;
s = trim(s);
if (!s.matches("\\d+")) return;
for (int i = 0; i < vals.length - 1; i++) vals[i] = vals[i + 1];
vals[vals.length - 1] = int(s);
}Three-value protocol
Design your own message format for three values (e.g. x,y,button from a joystick). Write the Arduino side with fake values from random(), and a Processing sketch that moves a circle with x/y and changes its colour when button = 1. Your parser must ignore malformed lines.
values.length == 3 and wrap each conversion. Test robustness by sending a broken line such as 12,, or hello.import processing.serial.*;
Serial myPort;
float px = 0, py = 0;
boolean pressed = false;
void setup() {
size(500, 500);
myPort = new Serial(this, Serial.list()[0], 9600);
myPort.bufferUntil('\n');
}
void draw() {
background(20);
fill(pressed ? color(198, 255, 61) : color(109, 74, 255));
float x = map(px, 0, 1023, 25, width - 25);
float y = map(py, 0, 1023, 25, height - 25);
ellipse(x, y, 50, 50);
}
void serialEvent(Serial p) {
String line = p.readStringUntil('\n');
if (line == null) return;
String[] v = split(trim(line), ",");
if (v.length != 3) return;
for (String s : v) if (!s.matches("\\d+")) return; // reject malformed lines
px = float(v[0]);
py = float(v[1]);
pressed = v[2].equals("1");
}Self-check quiz
- Q01
What is the Processing equivalent of Arduino’s loop()?
- Q02
In Processing, where is the point (0, 0)?
- Q03
Arduino uses Serial.begin(9600). What must Processing use?
- Q04
What does map(50, 0, 100, 0, 400) return?
- Q05
Arduino sends "24.5,60". What does split(trim(data), ",") give?
- Q06
Why must the Serial Monitor be closed before running Processing?
Real world & extensions
- +Real-time scrolling graph of the last 100 readings — arrays, shifting values (intermediate)
- +Save sensor data to a CSV file with
PrintWriter/saveStrings()(intermediate) - +Sound alarm on a threshold with the Minim library (advanced)
- +Multi-sensor dashboard in one window (advanced)
- +Web version with p5.js and the WebSerial API (challenge)
| Subject | Connection |
|---|---|
| Computer Science | Events, data structures, string parsing — serialEvent(), arrays |
| Mathematics | Coordinate systems, linear scaling, functions — map(), sin() |
| Physics | Interpreting measurements — temperature bars, distance radar |
| Visual Arts | Colour theory, composition, UI design |
| Technology | Systems thinking, hardware–software integration |
Reflection & conclusion
Explain the full journey of one sensor reading — from the physical world to a pixel on your screen — in your own words.
Why is it a good idea to validate incoming data before using it?
Where have you seen live data visualizations in everyday life (weather apps, fitness trackers, …)?
Processing is the visual bridge between the physical world and the screen. Once you understand how data flows from a sensor through Arduino’s serial port into Processing’s draw(), you can build any real-time visualization you can imagine. Serial setup, parsing, drawing with map(), and sending commands back to Arduino are a complete toolkit for every project that follows.