What you’ll learn
- 1Install and use an Arduino library (Adafruit DHT sensor library).
- 2Wire a digital sensor and explain the role of a pull-up resistor.
- 3Explain what relative humidity means physically.
- 4Send two measurements in one CSV line and parse them in Processing.
- 5Detect sensor errors with
isnan()and add a high-temperature alarm.
- DHT11
- A low-cost digital sensor for temperature (0–50 °C, ±2 °C) and humidity (20–90 % RH, ±5 %).
- Relative humidity (RH)
- How much water vapour the air holds compared with the maximum it could hold at that temperature, in %.
- Library
- Ready-made code you include to talk to a component without writing everything yourself.
- Pull-up resistor
- A resistor that keeps a signal line at HIGH when nothing is pulling it LOW.
- NaN
- “Not a Number” — the value returned when a reading failed. Test with
isnan(). - IoT
- Internet of Things — everyday objects with sensors that share data.
Required equipment
| Component | Qty | Purpose |
|---|---|---|
| Arduino Uno | 1 | Microcontroller |
| DHT11 sensor | 1 | Temperature and humidity measurement |
| 10 kΩ resistor | 1 | Pull-up resistor (only for the bare 3/4-pin sensor) |
| Breadboard | 1 | Component connection |
| Jumper wires | ~5 | Component connection |
| USB cable | 1 | Connection to computer |
| Arduino IDE + Processing | 1 | Programming and visualization |
Theoretical Background
What is the DHT11?
The DHT11 is a digital sensor: it measures temperature and relative humidity and sends the result as a digital signal. No analog-to-digital conversion is needed, it is easy to connect, and ready-made libraries exist — perfect for beginners.
What is relative humidity?
Relative humidity is the percentage of water vapour in the air compared with the maximum amount the air can hold at that temperature and normal pressure. Warm air can hold more water than cold air — that’s why a cold bottle from the fridge “sweats” on a warm day.
Serial communication
Arduino sends both readings in one line, separated by a comma:
Serial.println("24.5,60"); // temperature = 24.5 °C, humidity = 60 %Exercise 1 — Connecting the DHT11
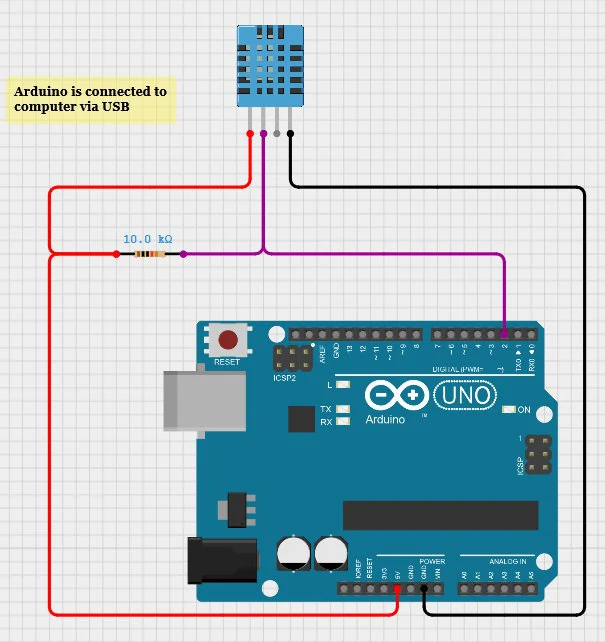
| DHT11 pin | Arduino pin |
|---|---|
| VCC | 5V |
| GND | GND |
| DATA | Digital pin 2 |
Using the bare 3/4-pin sensor? Place a 10 kΩ resistor between VCC and DATA.
Step 1 — Install the library
- 01In the Arduino IDE open Sketch → Include Library → Manage Libraries.
- 02Search for “DHT sensor library” by Adafruit.
- 03Click Install (accept the “Adafruit Unified Sensor” dependency).
Step 2 — Arduino code
#include "DHT.h"

#define DHTPIN 2
#define DHTTYPE DHT11

DHT dht(DHTPIN, DHTTYPE);

void setup() {
  Serial.begin(9600);
  dht.begin();
}

void loop() {
  float humidity = dht.readHumidity();
  float temperature = dht.readTemperature();   // Celsius

  if (isnan(humidity) || isnan(temperature)) {
    Serial.println("Failed to read from DHT sensor!");
    delay(2000);
    return;
  }

  Serial.print(temperature);
  Serial.print(",");
  Serial.println(humidity);
  delay(2000);                                 // DHT11: max. 1 reading per second
}| Command | Explanation |
|---|---|
dht.readTemperature() | Reads the temperature in °C |
dht.readHumidity() | Reads the relative humidity in % |
isnan(x) | True if the reading failed (Not a Number) |
Serial.print() | Sends data to the computer |
delay(2000) | Waits 2 seconds between readings |
Exercise 2 — Data Visualization in Processing
The sketch reads the data from Arduino, shows temperature and humidity as text, and visualizes both with bars.
import processing.serial.*;

Serial myPort;
float temp = 0, hum = 0;

void setup() {
  size(500, 260);
  myPort = new Serial(this, Serial.list()[0], 9600);
  myPort.bufferUntil('\n');
}

void draw() {
  background(255);
  fill(0);
  textSize(20);
  text("Temperature: " + nf(temp, 1, 1) + " \u00B0C", 50, 70);
  text("Humidity: " + nf(hum, 1, 1) + " %", 50, 150);

  fill(220, 50, 50);                                  // temperature bar 0–50 °C
  rect(50, 85, map(temp, 0, 50, 0, 400), 25);
  fill(50, 100, 220);                                 // humidity bar 0–100 %
  rect(50, 165, map(hum, 0, 100, 0, 400), 25);

  if (temp > 30) {                                    // alert system
    fill(255, 0, 0);
    text("WARNING: HIGH TEMPERATURE!", 50, 235);
  }
}

void serialEvent(Serial p) {
  String data = p.readStringUntil('\n');
  if (data != null && data.contains(",")) {
    String[] values = split(trim(data), ",");
    if (values.length == 2) {
      temp = float(values[0]);
      hum  = float(values[1]);
    }
  }
}import processing.serial.*;, moved reading into serialEvent() and added bars and the alarm.- 1readStringUntil('\n')"23.5,61.0"
- 2data != null
- 3data.contains(",")
- 4split(trim(data), ",")["23.5", "61.0"]
- 5values.length == 2length = 2
- 6float(values[0]), float(values[1])23.5, 61
Line accepted and displayed.
Student tasks
Troubleshooting
| Problem | Likely cause | Fix |
|---|---|---|
| No data received | Incorrect COM port | Use printArray(Serial.list()) to find the correct port. |
| “Failed to read” message | Poorly connected sensor or wrong pin | Check DATA → pin 2 and that DHTTYPE is DHT11 (not DHT22). |
| Unstable values | Poor contact on the breadboard | Press wires in firmly; avoid long loose jumpers. |
| Processing not receiving data | Serial speed mismatch | Both sides 9600 baud. |
Exercises
Read the datasheet
The DHT11 datasheet says: range 0–50 °C, accuracy ±2 °C; humidity 20–90 % RH, accuracy ±5 %. Your sensor shows 22 °C and 48 %. What are the possible real values? Could you use this sensor in a freezer?
Parse it in your head
For each line Arduino might send, write what temp and hum become in the Processing sketch (or “unchanged”): 25.0,40.0 · Failed to read from DHT sensor! · 26.1, · 27.3,55.0,1
contains(",") and values.length == 2.25.0,40.0 → temp 25.0, hum 40.0. · Error line → unchanged (no comma). · 26.1, → split gives ["26.1", ""], length 2, so temp = 26.1 and hum = NaN — a hidden bug! · 27.3,55.0,1 → length 3 → unchanged. Improvement: also check that both parts are not empty.Comfort zone indicator
Classrooms are comfortable between 20–24 °C and 40–60 % RH. Add a large circle to the Processing sketch that is green inside the comfort zone, yellow if only one value is outside, and red if both are outside. Write the status text next to it.
boolean tempOk = temp >= 20 && temp <= 24;
boolean humOk  = hum >= 40 && hum <= 60;
int bad = (tempOk ? 0 : 1) + (humOk ? 0 : 1);

if (bad == 0)      fill(0, 200, 90);
else if (bad == 1) fill(255, 200, 0);
else               fill(230, 40, 40);
ellipse(440, 40, 40, 40);

fill(0);
textSize(14);
text(bad == 0 ? "Comfortable" : bad == 1 ? "Check climate" : "Uncomfortable", 330, 80);Dew point estimate
A simple approximation for the dew point (the temperature at which water condenses) is Td ≈ T − (100 − RH) / 5. Calculate Td for (a) 25 °C / 60 % and (b) 18 °C / 90 %. Then add the calculation to Processing and display it.
float dew = temp - (100 - hum) / 5.0;Log to a CSV file
Save every reading with a timestamp to weather.csv so you can open it later in a spreadsheet and draw a chart.
PrintWriter output = createWriter("weather.csv"); in setup(), output.println(...) in serialEvent(), and output.flush(); output.close(); when a key is pressed.PrintWriter output;
// in setup():
output = createWriter("weather.csv");
output.println("time,temperature,humidity");
// in serialEvent(), after parsing successfully:
String stamp = nf(hour(), 2) + ":" + nf(minute(), 2) + ":" + nf(second(), 2);
output.println(stamp + "," + temp + "," + hum);
void keyPressed() {
if (key == 's') { // press S to save and stop
output.flush();
output.close();
exit();
}
}Classroom climate study
Run a real investigation: log the classroom climate for one full lesson with windows closed and one with windows open. Plot both datasets, compare the averages, and write a short recommendation for your school (how often should you ventilate?).
- 01Formulate a hypothesis.
- 02Collect data with your logger (P1.5).
- 03Compute min, max and average for each condition.
- 04Present a chart and a 5-sentence conclusion.
Self-check quiz
- Q01
What does the DHT11 measure?
- Q02
What does isnan(temperature) check?
- Q03
Why does the code wait 2 seconds between readings?
- Q04
Warm air can hold … water vapour than cold air.
- Q05
The 4-pin bare DHT11 needs a 10 kΩ resistor between…
Real world & extensions
- +Add an OLED display
- +Send data over WiFi (ESP32)
- +Create a web dashboard
- +Connect to a cloud platform (ThingSpeak, Blynk)
- +Build a complete mini weather station with a pressure sensor
| Subject | Connection |
|---|---|
| Physics | Temperature, humidity, measurement accuracy |
| Computer Science | Libraries, data formats and parsing |
| Technology & Engineering | Electronics and digital sensors |
| Mathematics | Data analysis, averages and graphs |
| Biology / Geography | Climate, comfort zones, plant growth conditions |
Reflection & conclusion
Where would you place the sensor in a room to get a fair measurement? Why not next to the radiator or window?
Our sensor is ±2 °C accurate. Is that good enough for a weather station? For a hospital incubator?
How could this project help save energy at school?
This project introduced working with digital sensors, libraries, and two-value data streams. By combining the Arduino Uno with Processing you built a real-time climate monitor — the same principle used in smart homes, greenhouses and weather stations around the world.